

Insights: reports, analytics, and the exec view
The Insights section is where the operation reads itself: cadenced reports, live analytics, deterministic cost math with AI explanation on top, the sustainability scorecard, and — for operator groups — one roll-up across every client organization.
Reports
Insights → Reports generates operating reports on the cadence each audience needs: daily runs the shift, weekly runs the site, monthly runs the account, quarterly briefs the board. Reports pull the real numbers — production, audits and scores, covers and dining ratings, clinical intake, cost, downtime — and AI can draft the narrative around them (with the numbers computed deterministically either way; quarterly board reports are a Pro and Enterprise feature). Email subscriptions deliver reports on schedule.
Analytics
Insights → Analytics is the live dashboard layer per site and organization — trends across the modules you use, from audit scores to covers to waste. The home Dashboard gives every signed-in user the day at a glance, scoped to their role.
Cost intelligence
Insights → Cost intelligence (Pro and Enterprise) answers two expensive questions with deterministic math:
- Usage variance — what production should have consumed (from done runs and published recipe usage) versus what inventory actually moved, costed line by line, with waste split out and untracked movement given its own rows — often the real story.
- Price variance — receiving-cost drift over the period, per item, so a supplier's creep is visible early.
- Menu engineering — popularity (production plus captured orders and selections) against contribution margin, split into the classic quadrants: stars, plowhorses, puzzles, dogs. Unpriced items are classed as unpriced, never punished as dogs — most noncommercial menus are mostly unpriced, and the math respects that.
AI adds root-cause commentary and suggested plays on top; the numbers never depend on it.
Sustainability
Insights → Sustainability tracks the program the board asks about: waste trends by reason, weight, and cost; the donation log with estimated meals; local-sourcing percentage from vendor-flagged spend; plate-waste study mode; and organization goals with a scorecard — including CO2e estimates.
The exec roll-up
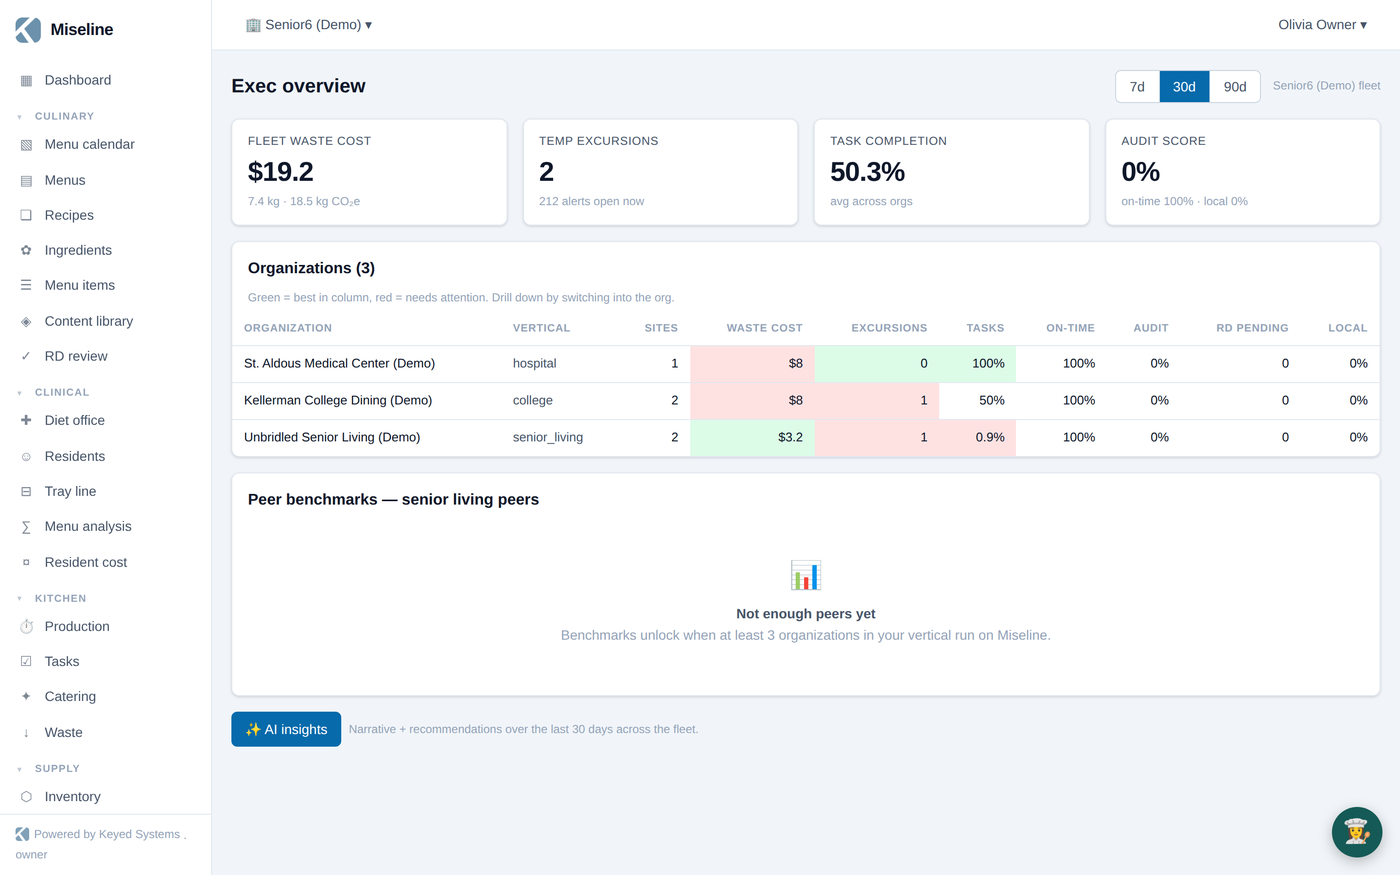
For operator organizations (Enterprise), Insights → Exec roll-up is the fleet view across client organizations: sites, open alerts, audit scores, task completion, and per-vertical breakdowns, averaged across the fleet with drill-down into any client. Client organizations' data otherwise stays their own — the roll-up is a deliberate, admin-only window. Peer benchmarks (Pro and Enterprise) show how a site compares on shared KPIs without exposing anyone's identity.
The assistant
The in-app Assistant answers operational questions in plain language — today's menu, who's on shift, where to log waste — grounded in your organization's own data. Admins configure it (name, color, visibility) from Agent settings; like every AI feature, it's optional and the platform is fully usable without it.
The marketplace
Insights → Marketplace shares templates and packs: browse what's published to the platform or to your operator group, and — on Enterprise — publish your own for your clients.
Tips
- Start every leadership meeting from the same report cadence — the numbers stop being debatable when everyone reads the same computed sheet.
- Treat "untracked usage" lines in cost variance as the to-do list for inventory hygiene; they point at unlinked items and ad-hoc production.
- Benchmarks are directional, not a scoreboard — use them to pick which of your own trends to work on next.